Every summer, the New York Thoroughbred Horsemen's Association (NYTHA) takes in a small gaggle of college-age interns–what for many of them proves a baptism of the turf.
This year's batch–three Yale undergrads studying economics, electrical engineering and political science–were tasked with a data-driven analysis of the economics of the national horse racing biz over the past 20 years.
Harboring no previous relationship with the industry, the three undergrads came in free of prejudice and preconceptions.
The result is a 33-page paper weaving piercing and worrying insights into the state of racehorse ownership, racetrack management and training in the country alongside findings that give tentative cause for optimism.
It's also the sort of detailed analysis of horse racing's economic foundation stones that's done all too infrequently for an industry of this size and scope.
“We've been a sport that traditionally makes decisions either around general 'chat around the pub,' or just whatever the richest guy in the room thinks,” said Joe Appelbaum, NYTHA president and an advisor on the study.
“Neither is usually a good one to make good economic decisions from,” he added.
Among the areas the three researchers focused in on were owner, trainer and horse participation; purse and handle trends; the bloodstock market; along with a side-by-side economic analysis of horse racing and other national sports.
They break their key findings down the following way:
- That the 2008 global financial meltdown significantly hastened the decline in trainer numbers, owner interest numbers and participating racehorses.
- That two areas–bloodstock prices and per-capita purse distribution–showed surprising resilience during that time.
- More pointedly, with fewer horses competing for increased purses per race, individual owner entities have generally been doing slightly better financially over the last 20 years.
- Despite areas of improved economic value for owners, costs remain high while the entertainment value of the sport appears to be declining due in part to horses racing less and working more.
- The economic divide between the bigger and smaller trainers remained unchanged over the past 20 years. That said, such a divide is a characteristic of other national professional sports.
- A consolidation of quality horses among fewer and fewer of the nation's largest stables has also triggered growing inequality among the top trainers.
- At the end of the day, the not-for-profit model of certain racetracks coupled with the “capitalist nature” of Kentucky's breeding market could serve as models for other areas of the industry.
The detailed analysis warrants a much closer look at some of the statistics woven through it, several of which mirror the TDN's own prior dives into similar topics.
PARTICIPATION
The past 20 years has seen a decrease of nearly 40% in total horses that raced, a decrease of nearly 55% in total trainers that had at least one horse make a start, and a decrease of just over 42% in the number of owners who owned at least one horse.
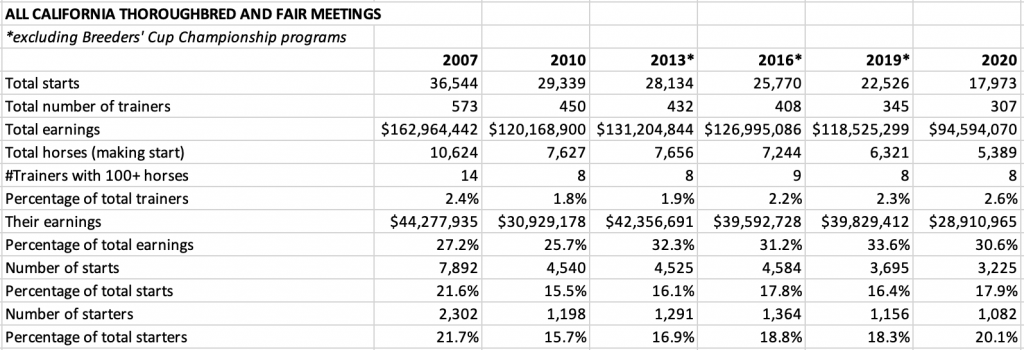
Interestingly, the sharp drop in trainer numbers has been reflected in the TDN's own examination of California's trainer colony. Between 2007 and 2020, California witnessed a 46.4% decrease in the number of individual trainers making at least one start: from 573 in 2007 to 307 in 2020.
Hastening the speed of these declines was the 2008 global financial meltdown.
As the researchers write, “it accelerated the declines among horses and owners, and although trainers were already leaving the industry at a significant rate prior to the recession, trainers were still impacted by the economic crisis as they rely on owners to give them their horses.”
Since the COVID-19 pandemic, however, there have been tentative signs of plateauing declines in the number of participating owner interests and competing horses.
In what will prove a surprise to no careful observer of the sport, the last 20 years has also witnessed a 37% drop in the number of races run nationally, and a 45% drop in the number of individual starts.
“The landscape of the horse racing industry has changed a lot over the past 20 years as it has lost close to half its existing participants and 37% of its total races,” the researchers write.
“As the number of races, owners, and trainers continues to decrease across the country,” they warn, “the survival of horse racing is threatened.”
PURSE DISTRIBUTION
An inflation-adjusted look at purse levels show that total purses declined by nearly 25% between 2003 and 2023.
However, declines in the number of overall races run nationally over that same period has led to a situation of improved per-race, per-start economics for owners and trainers.
Indeed, inflation-adjusted purse-per-race numbers increased nearly 18% during that time, while inflation-adjusted purse-per-start numbers increased nearly 30%.
In another similarly themed section, the researchers took a stab at quantifying the cost of owning a horse, using numbers shared by one of the nation's “leading racing operations,” which remained unnamed.
Calculating typical training costs, the average days a horse is in training, farm costs, predicted jockey fees, and stable fees, the researchers estimated that the average annual earnings by a horse required to break even for its owner in 2022 was around $66,500.
In 2003, a horse had to win more than $41,810 for the owner to profit, they found.
The findings suggest that the number of horses “breaking even” for their owners over the past 20 years grew from below 8% in 2003 to over 11% in 2022.
Unsurprisingly, there were precipitous drops in the numbers of “breaking even” horses during the 2008 economic collapse and during the worst impacts from COVID-19.
The reason for this overall increase, the researchers write, is twofold.
“There are fewer horses racing, which is an effect of the decrease in the supply of foal crop,” they wrote. “And there is a higher amount of money available due to the alternative revenue provided through the casinos at the tracks.”
FOAL CROP AND SALES
The sales rings provided the researchers with another area for optimism.
“As the economy in general and horse racing in particular emerged from the Great Recession,” they write, “one area of clear strength has been the increasing value of bloodstock at all levels.”
Indeed, the inflation-adjusted average price of weanlings, yearlings and 2-year-olds increased over the past 20 years by just over $14,500. The same goes for median prices.
Since a recession-led low back in 2009, the median sales price increased 48% to a level of $30,000 in 2022.
“This upward trend in the median price indicates that a wide range of bloodstock assets, not only just the high-end ones, have experienced value appreciation,” the researchers write.
Why is this? The researchers contend that simple supply and demand is at play as the national foal crop has declined nearly 50% over the past 20 years.
“As the supply of horses eligible to be auctioned decreased due to the lower foal crop, breeders and sellers found themselves with fewer horses. Notably, the demand for these horses remained relatively constant, or in some cases, may even have increased,” the researchers write.
The combination of reduced supply and stable demand has led to an “upward pressure on prices,” they add.
SUPER TRAINERS
The researchers also tackle one of the bete-noirs of the industry–the issue of so-called “super trainers.”
Over the last 20 years, the industry has lost nearly 55% of its trainers. Most have been “micro-trainers” and “midsize” trainers–in other words, those with between 1-10 discreet horses, and between 11-40 discreet horses respectively.
Fewer races, horses, and owners invariably lead to fewer trainers, the researchers reasonably deduce. At the same time, existing stables have consolidated size.
The average horse-per-trainer ratio has grown from 8.2 horses per trainer in 2003 to 11.1 in 2022.
“With owners preferring trainers with more horses, the micro-trainers are losing out on potential clients and struggling to maintain a sustainable business,” the researchers warn. “Many of them may have decided to exit the industry altogether due to the diminishing demand for their services.”
At the opposite end of the scale are “super trainers” who operate stables with 80 or more horses.
The number of super trainers has stayed relatively constant in the midst of declining trainer numbers. In 2003 there were 123 super trainers, and in 2022 there were 114.
These findings mirror the TDN's own analysis of the training colony in California. While the number of active trainers in California almost halved between 2007 and 2020, the number of trainers with 100-plus horses making starts stayed fairly constant.
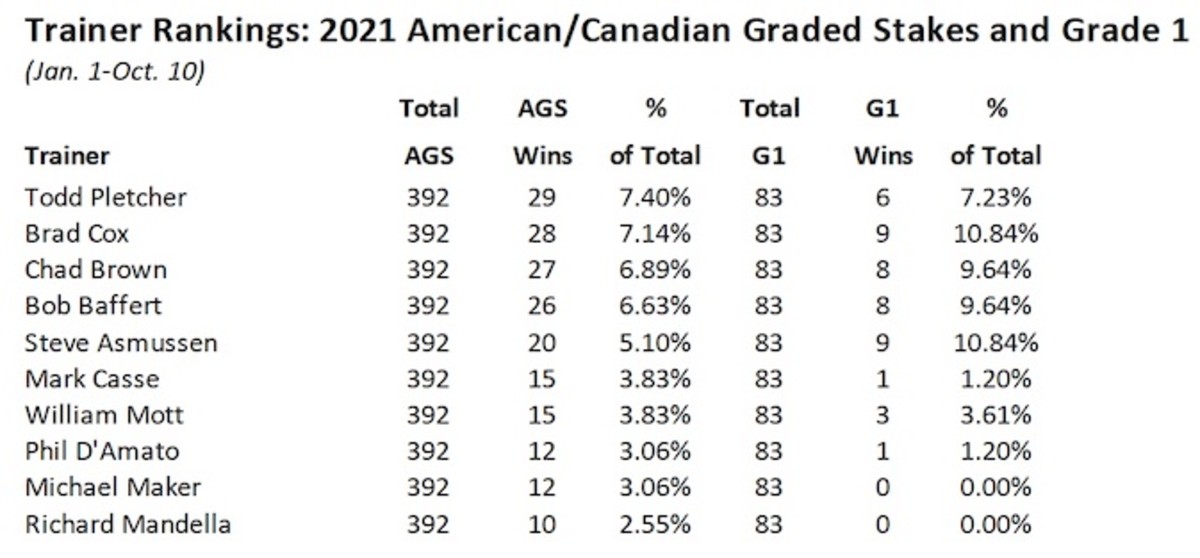
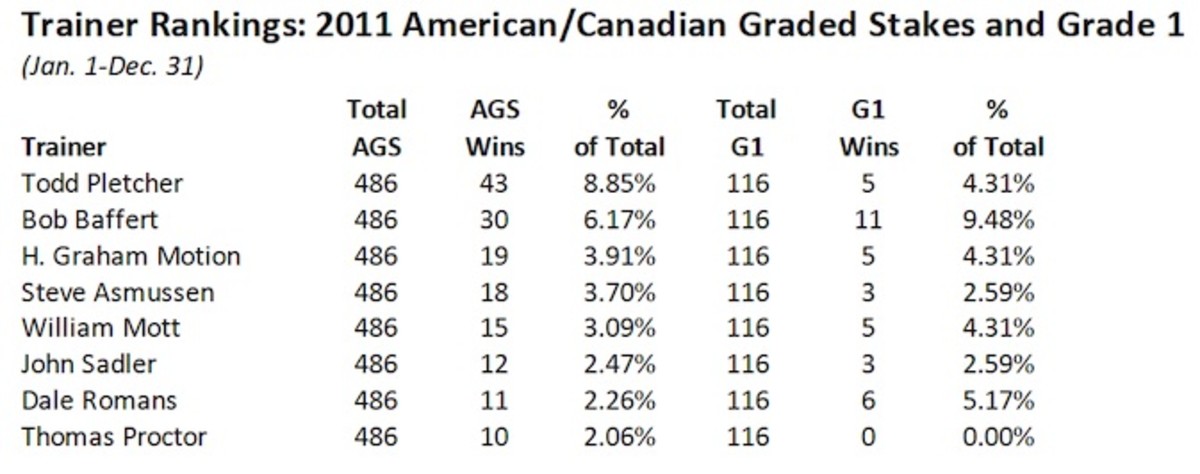
At the same time, the Yale researchers found that the nation's super trainers have significantly increased their percentage share of total available winnings over 20 years, from 27% in 2003 to 41% in 2022.
This means that last year, 114 “super trainers”–just 3% of the total number of active trainers–accrued 41% of the total available winnings.
Intriguingly, the researchers argue that this yawning disparity between racing's select few top-tier trainers and the rest is mirrored in other professional sports, like golf and football.
“Horse racing is a unique sport as it does not have many similarities to popular sports in the country, but so is golf, and despite being unique, they are both sports that have similar issues that must be overcome to participate,” the researchers write.
“Neither is easy to stay in, especially if you are not in the top percent,” they add. “It is hard to win, hard to profit, and hard to compete, but that is exactly what makes them both sports in the first place.”
WHAT TO DO?
The report has other intriguing findings, including how the income disparity seen among trainers is reflected between racetracks, with only a select few tracks thriving and offering competitive purses.
Ultimately, said Appelbaum, the report could and perhaps should trigger a couple of key industry responses.
One would be to decrease the regulatory burden “as much as possible,” especially when it comes to the Horseracing Integrity and Safety Act and to sports wagering.
“The current regulatory regime both in New York and around the country is really a bit redundant and not in step with the current sports wagering environment,” he said.
The other would be to regionalize circuits of racing to provide for “better planning of races between tracks and jurisdictions,” he said.
At the end of the day, the report should also spur more of these in-depth analyses into the economic building blocks of the sport.
“Why is it three college-age interns are doing this?” Appelbaum added. “Why aren't we doing more of this ourselves?”
The post Yale Study of Racing Biz: Areas of “Surprising Strength” Amid Sharp Declines appeared first on TDN | Thoroughbred Daily News | Horse Racing News, Results and Video | Thoroughbred Breeding and Auctions.


